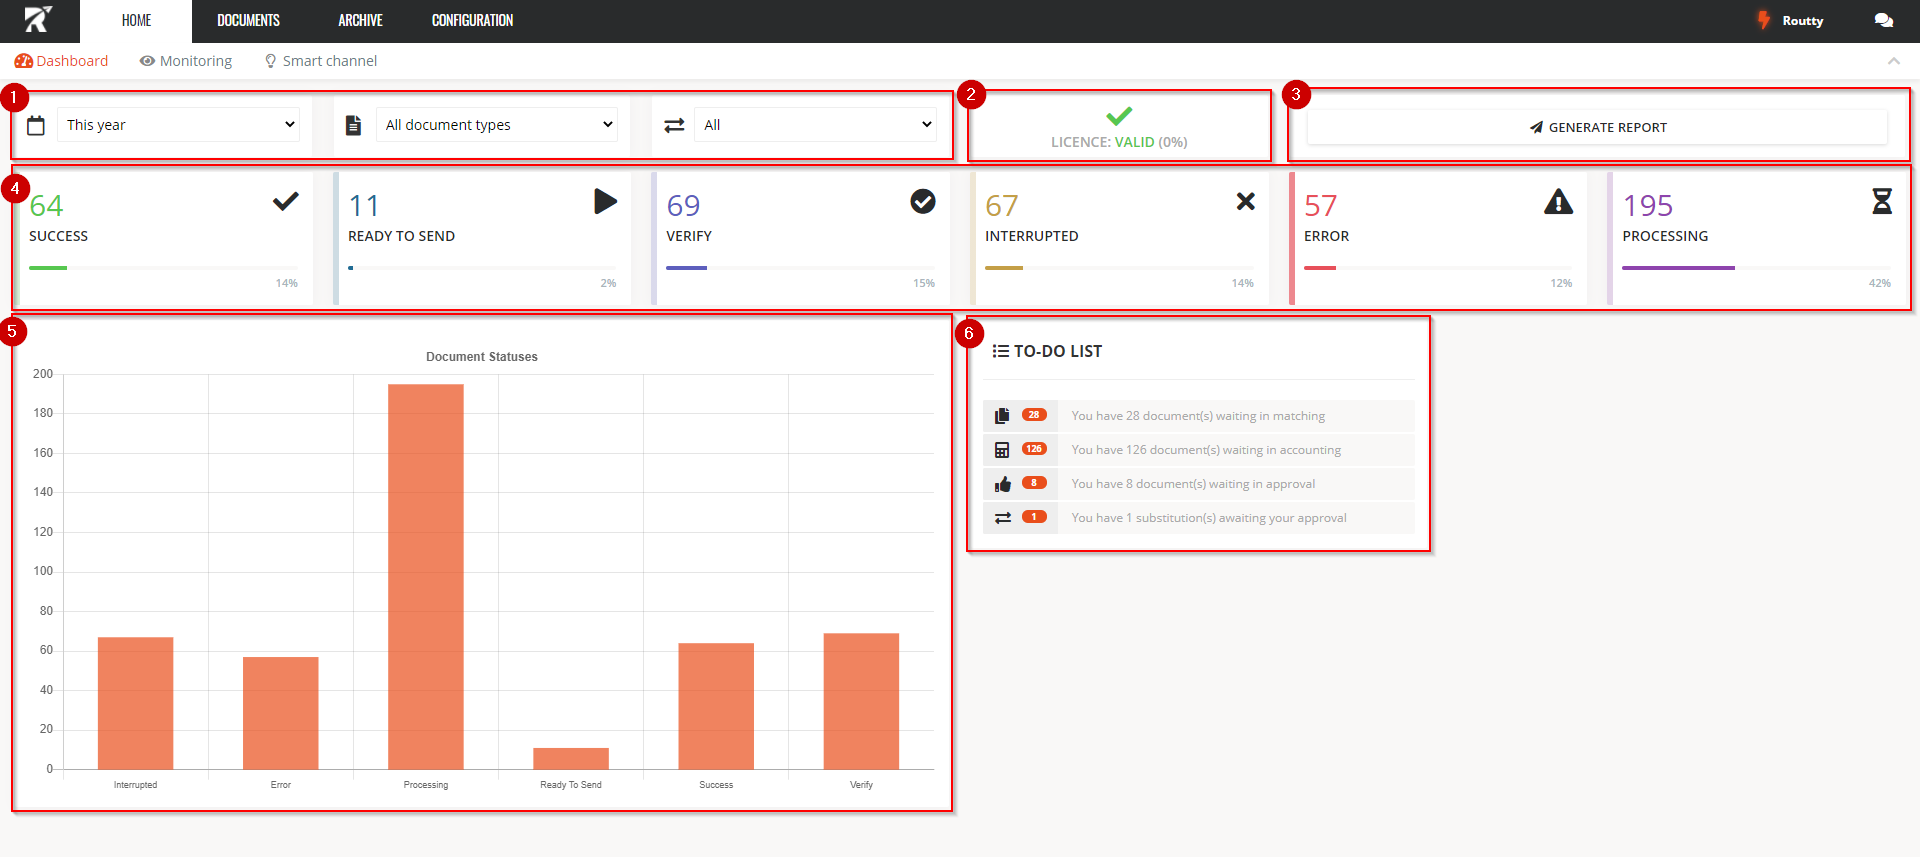
The dashboard is the first screen a user usually sees upon entering routty. It shows a quick overview of the current state of documents in routty and user-specific actions.
-
The filter area allows you to filter the dashboard based on some variables, you can use:
-
The date when a document was created in routty
-
The type of document
-
The direction of the document flow
-
-
The license module shows you an up to date overview of your current license usage, when hovering over the license, a more detailed view is shown
-
The reporting module sends a mail to the user with a basic csv report, this module can be expanded with custom information in a csv upon request
-
The status tiles highlight the number of documents in a certain status, based on the filters set in 1.
When clicked, each status tile redirects to the Monitoring screen with the correct filter activated. -
This bar chart displays the same information as 4, in a different way
-
The to-do list is an up to date and specific overview for each user of the actions that he needs to take in routty. It shows assigned documents in any step of any business flow and also shows any unread messages.